
Fall Term Update: Parthasarathy Lab Rotation
University of Oregon Lab Rotations
At the University of Oregon (and many other graduate schools throughout the country), the first year of your PhD is dedicated to spending a couple of month in a single lab to get acquainted with the school, different styles and topics of research, and learn what you will want to eventually focus on when you begin to pursue your dissertation. In my case, I will rotate through three different labs and then decide on a final lab hopefully sometime in June 2022. For my first rotation, I joined the Parthasarathy lab!
The Parthasarathy Lab
 The lab is led by Raghuveer Parthasarathy (Raghu), he is awesome! He is extremely knowledgable and was an amazing mentor throughout my time in the lab.
The Parthasarathy lab, as described on the lab website, are…
“biophysicists exploring the structure and dynamics of biological materials such as cellular membranes, the gut microbiome, and the organs of developing animals. We’re also interested in general questions of how soft materials and complex fluids self-organize. We explore these issues using a variety of techniques, with special emphasis on optical microscopy and computational image analysis”
I wanted to rotate with Raghu and the Parthasarathy lab because I have almost no experience with microscopy and they do almost exclusively microscopy. I wanted to dive head first into something completely new and challenge myself to learn something that I didn’t know before. Check out some of the awesome videos that the lab has taken in the past!
Bacteria, antibiotics, and agar oh my!
In research labs, we often find bacteria on plates and in tubes, but this isn’t representative of bacteria in real life. In real life, bacteria grow in 3D and this makes it challenging to study bacteria (and many other microorganisms) as they grow and move in 3 dimensions. While we can obviously grow bacteria easily in 3D, it is difficult to image and observe bacteria in 3 dimensions. This is a problem that the Parthasarathy lab has been working on for a long time.
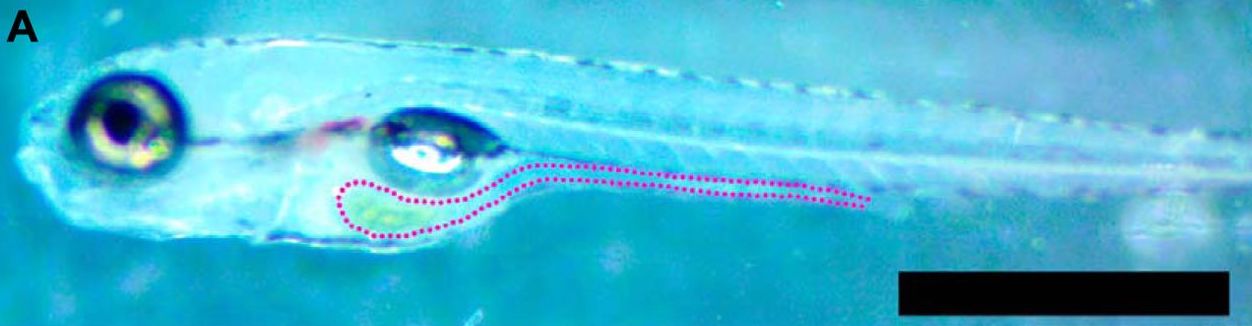
Previously, others in the lab have used zebrafish since, in the developmental stages when they are being colonized by bacteria, they are transparent. This allows for microscopy from multiple angles to be able to image bacteria in 3D as they colonize and establish themselves within the guts of zebrafish. In this way, you are able to study how bacteria arrange themselves in the guts of the developing zebrafish.
 |
|---|
| Sundarraman, et al., 2020 - https://doi.org/10.1128/mBio.01667-20 |
However this term, I look at bacterial aggregation in a different system…
But before getting to my own project, I first need to introduce Dr. Melanie Spero!

Dr. Spero just joined the University of Oregon and is in the process of opening her own lab. She is coming to the University of Oregon after working as a postdoc in the Newman Lab at CalTech where she began studying how pathogen physiology affects human health outcomes.
Dr. Spero developed a really cool way to image Pseudomonas aeruginosa termed the agar block biofilm assay or ABBA. In this assay, bacteria are used to inoculate a piece of agar and allowed the grow into large colonies. Dr. Spero then imaged these bacterial colonies using confocal microscopy. In this first panel, we see the growth of Pseudomonas at varying depths within the agar. Closer to the surface of the agar, we see large colonies. As you go deeper into the agar, colony size decreases.
 |
|---|
| Spero and Newman, 2018 - https://doi.org/10.1128/mBio.01400-18 |
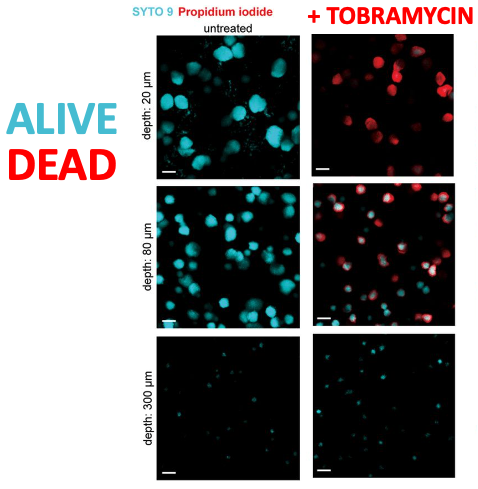
Next, Dr. Spero added tobramycin, an antibiotic, to the agar block and then again imaged using the confocal microscope. Here, dead Pseudomonas are shown in red and living Pseudomonas are shown in cyan. The effect of the tobramycin seemed to follow a depth-dependent pattern. Colonies that were deeper in the agar were not affected by the tobramycin whereas the colonies at the very top of the agar were completely killed. Additionally, colonies at an intermediate depth (i.e. the middle of the agar) seemed to show an intermediate effect where some of the Pseudomonas were killed and others were not. Dr. Spero found that there was a significant oxygen gradient from the top of the gel (where oxygen was abundant) to the bottom of the gel (where the environment was basically anoxic).
Like I’ve already mentioned, all of these images were taken using a confocal microscope. However, there are some downsides to consider with confocal microscopy.
- Due to photobleaching effects and phototoxicity to the bacteria, these bacteria were only able to be imaged at a single time point after the addition of the tobramycin.
- Also, each image takes 10-15 minutes to obtain, making it difficult to obtain fine resolution time scale experiments even if we could overcome the photobleaching and phototoxicity.
Okay… but Patrick… What have you been doing for the last 3 months?
In confocal microscopy, the microscope scans in all 3 direction (x, y, and z) in order to obtain the image. Essentially, a confocal microscope is only imaging a single point at any single time but fluorophores outside this point are excited but not imaged, leading to photobleaching and phototoxicity.
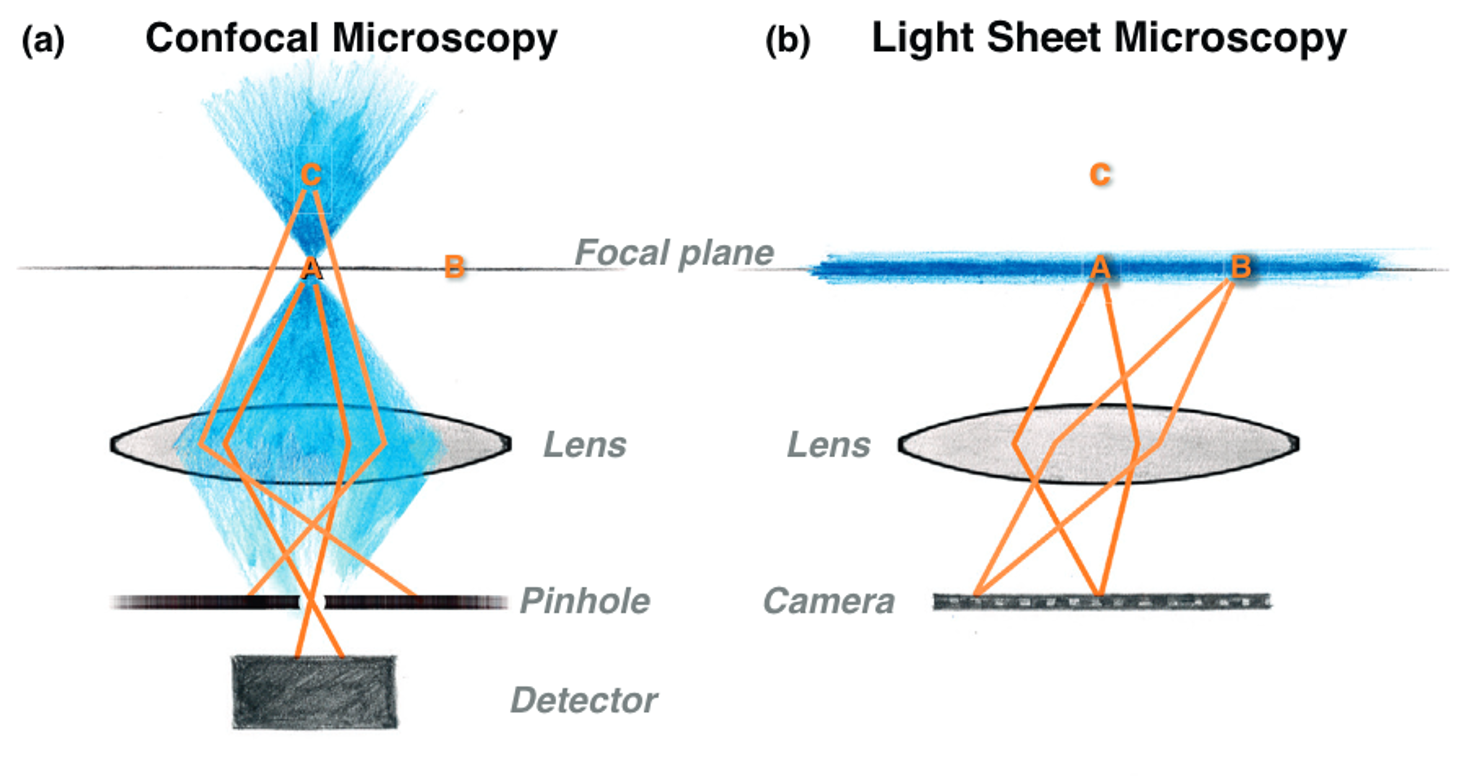
One thing that I didn’t mention before is that Raghu and his lab are some of the leaders in using light sheet fluorescence microscopy (LSFM), or light sheet microscopy as I’ll call it. In light sheet microscopy, only fluorophores in the focal plane are excited, and their emission is mapped onto a camera. This provides an image of the entire plane at any instant, not just at a point. Because of this, you only also have to scan in a single direction and everything that the light is touching is being detected, increasing the speed of imaging and decreasing potential photobleaching.
So after talking to Melanie and Raghu, we decided that we could combine the ABBA assay that Dr. Spero developed and the expertise that Raghu has in microscopy to try to understand how these Pseudomonas grow and react to antibiotics. Dr. Spero showed that there is absolutely an oxygen dependent mechanism that underlies the growth of the Pseudomonas over time, but this wasn’t the only factor that could be contributing to the growth patterns that we are seeing. There is also bacterial competition, bacterial consumption of oxygen outside of the gradient established by the agar, and the potential consumption of nutrients within the agar that could all shape the structure of these bacterial communities. So, just some of the questions that we went into this project hoping that we could start to answer were:
- Can we watch colonies over time?
- Can we spatialy resolve growth and death over time?
- Can we observe bacterial interactions that lead to community structure?
We had no idea if this would work but that’s what rotation projects are for!
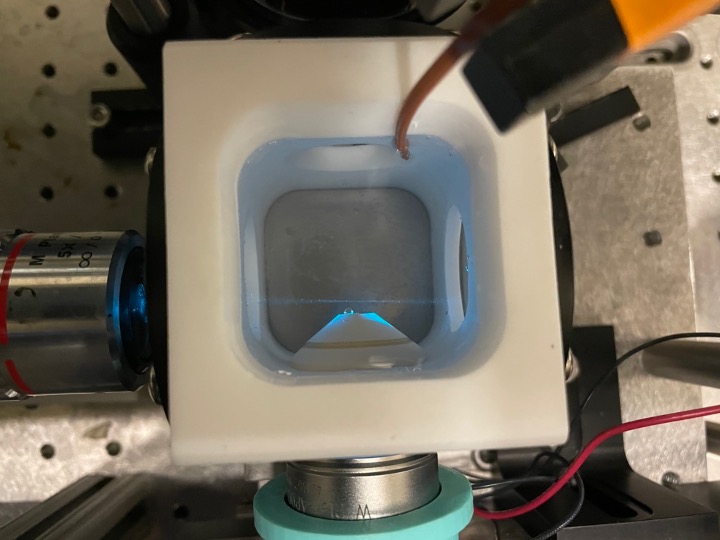
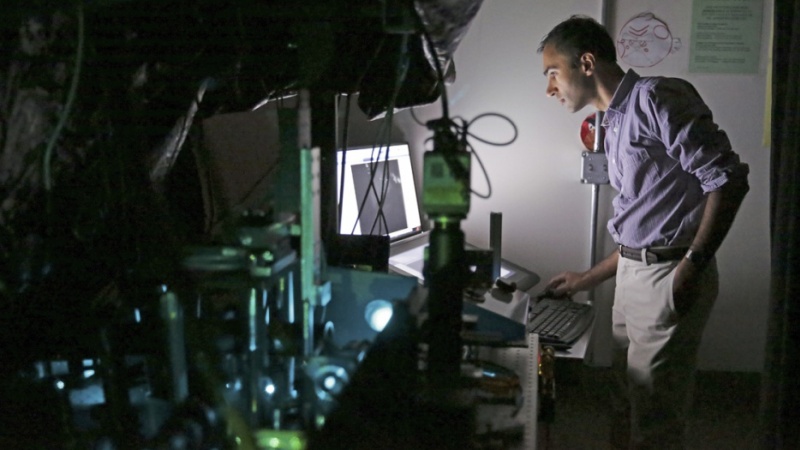
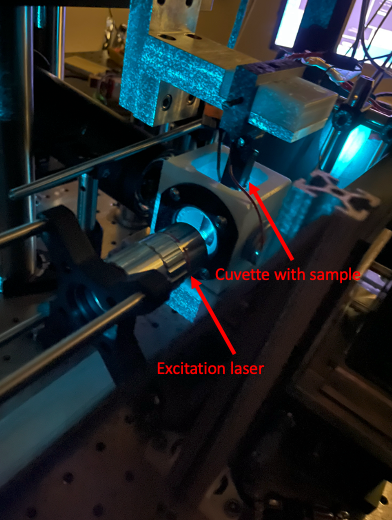
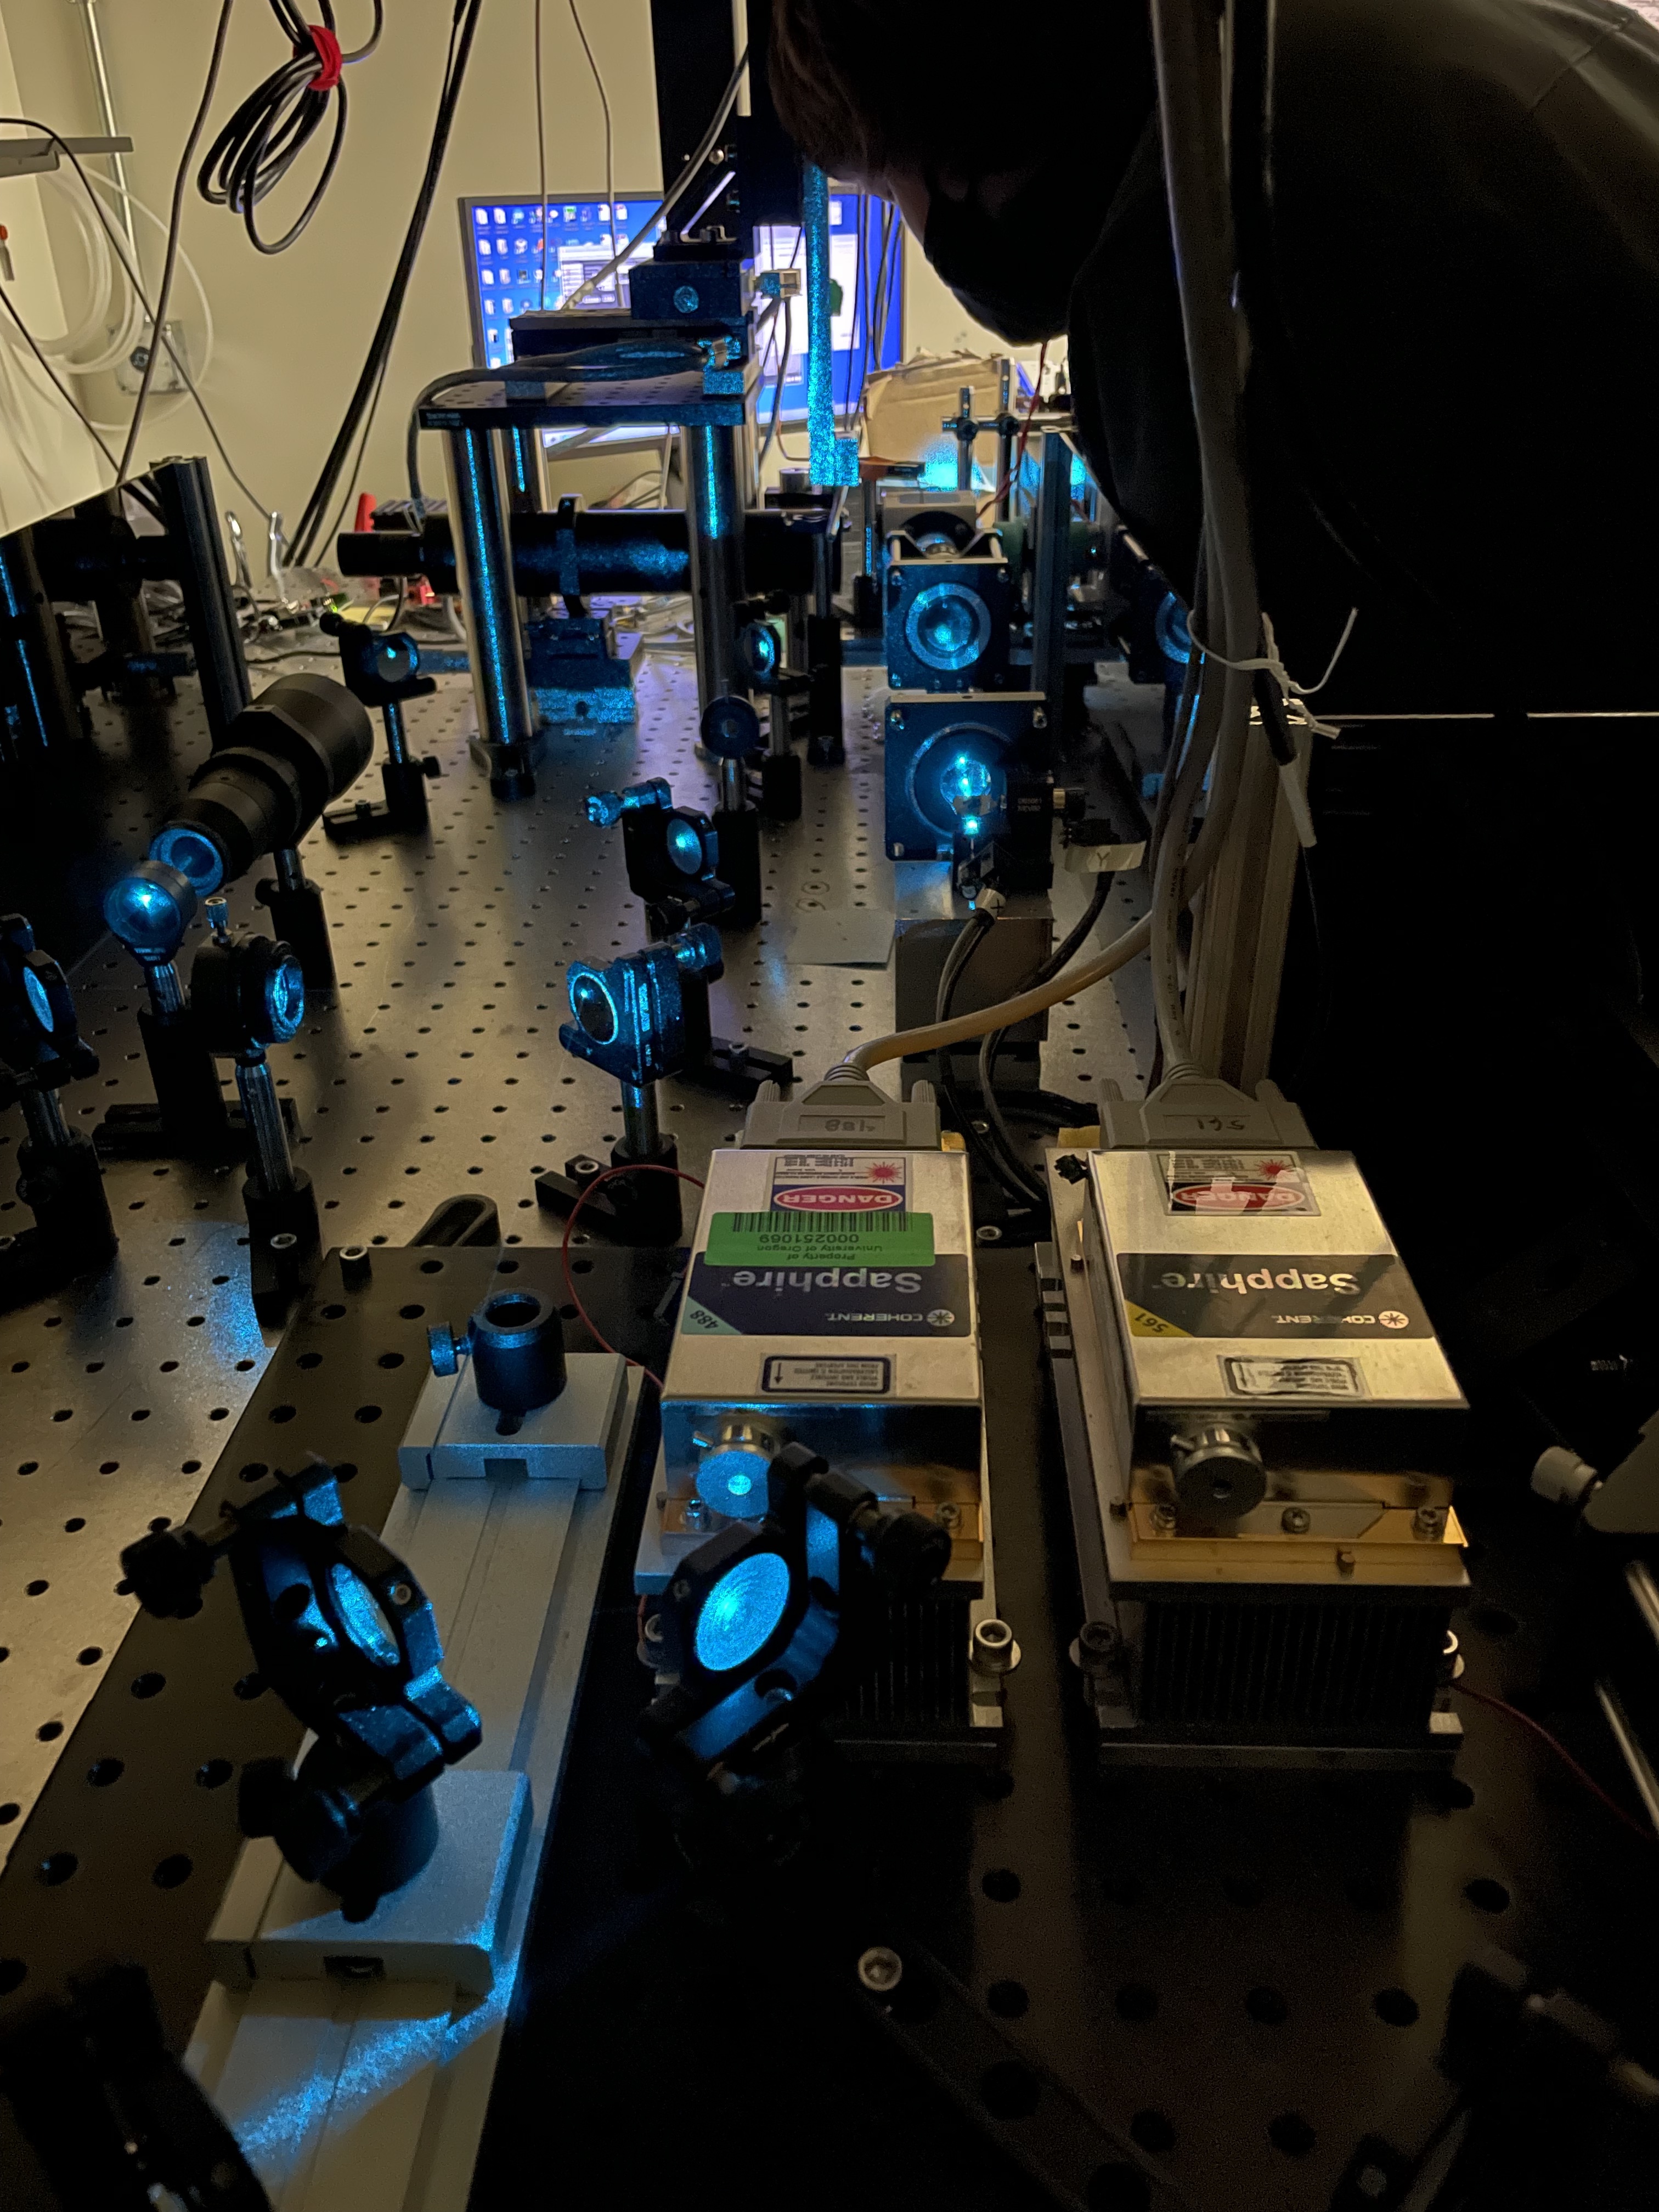
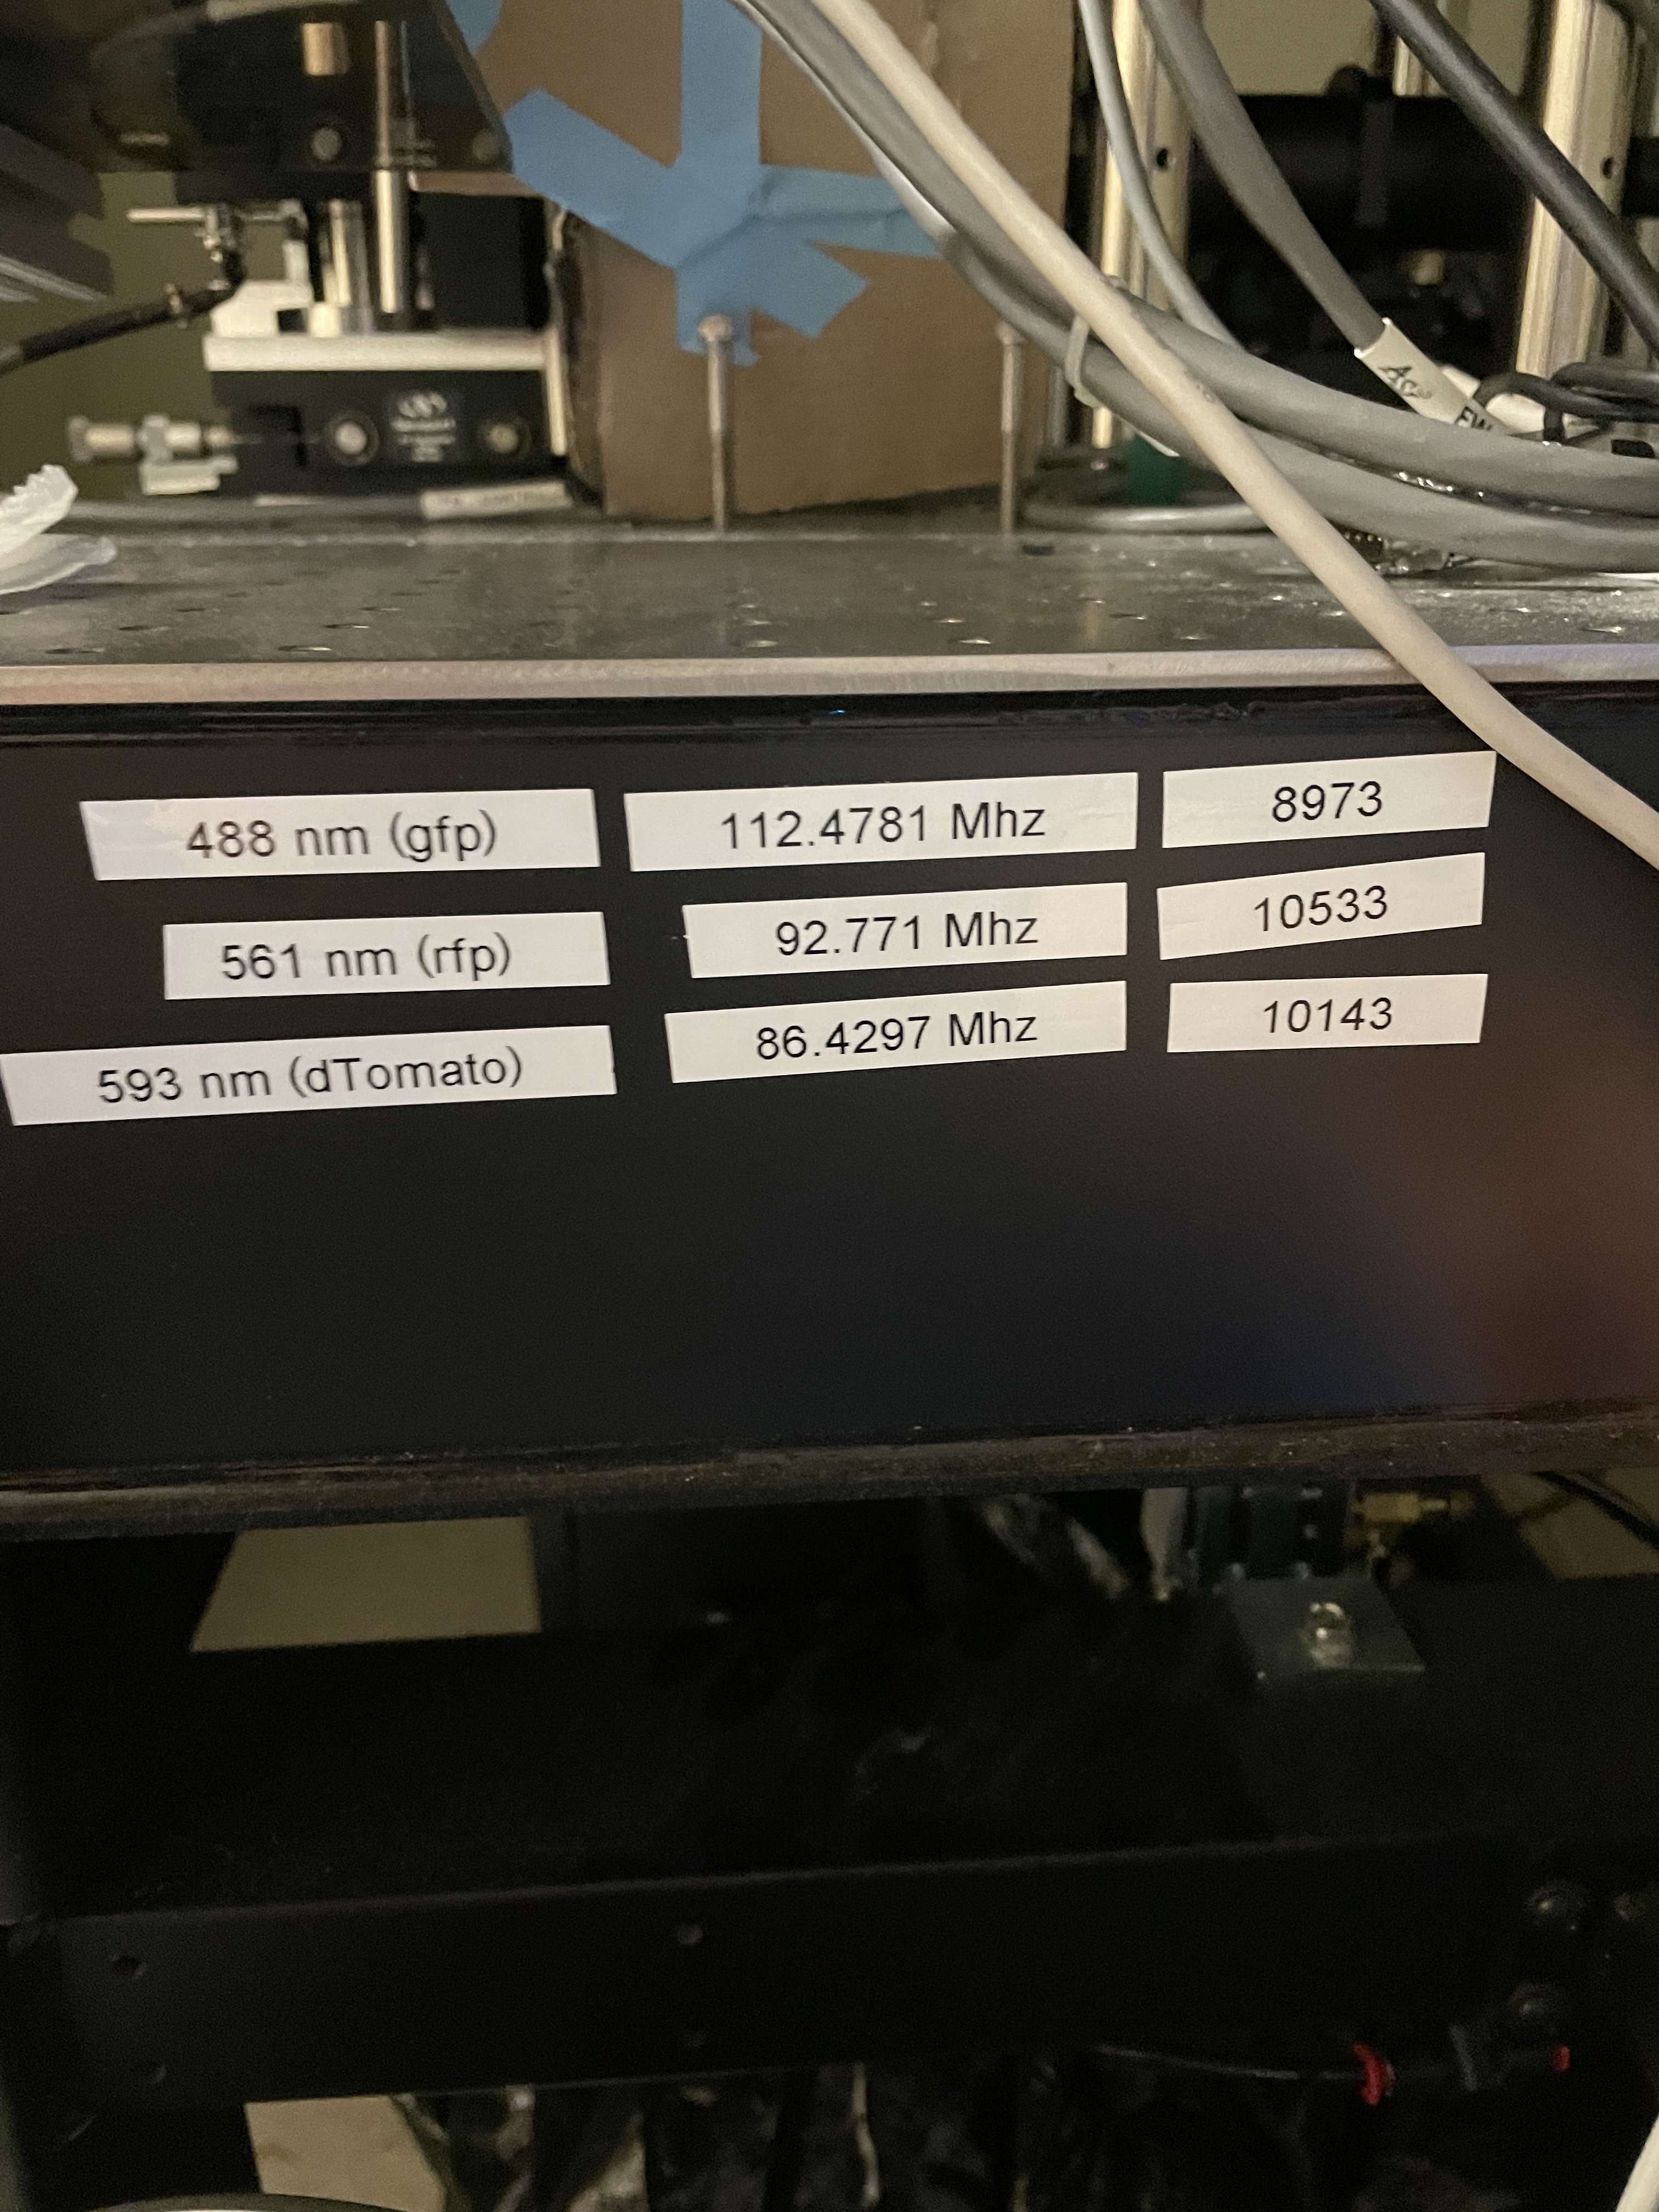
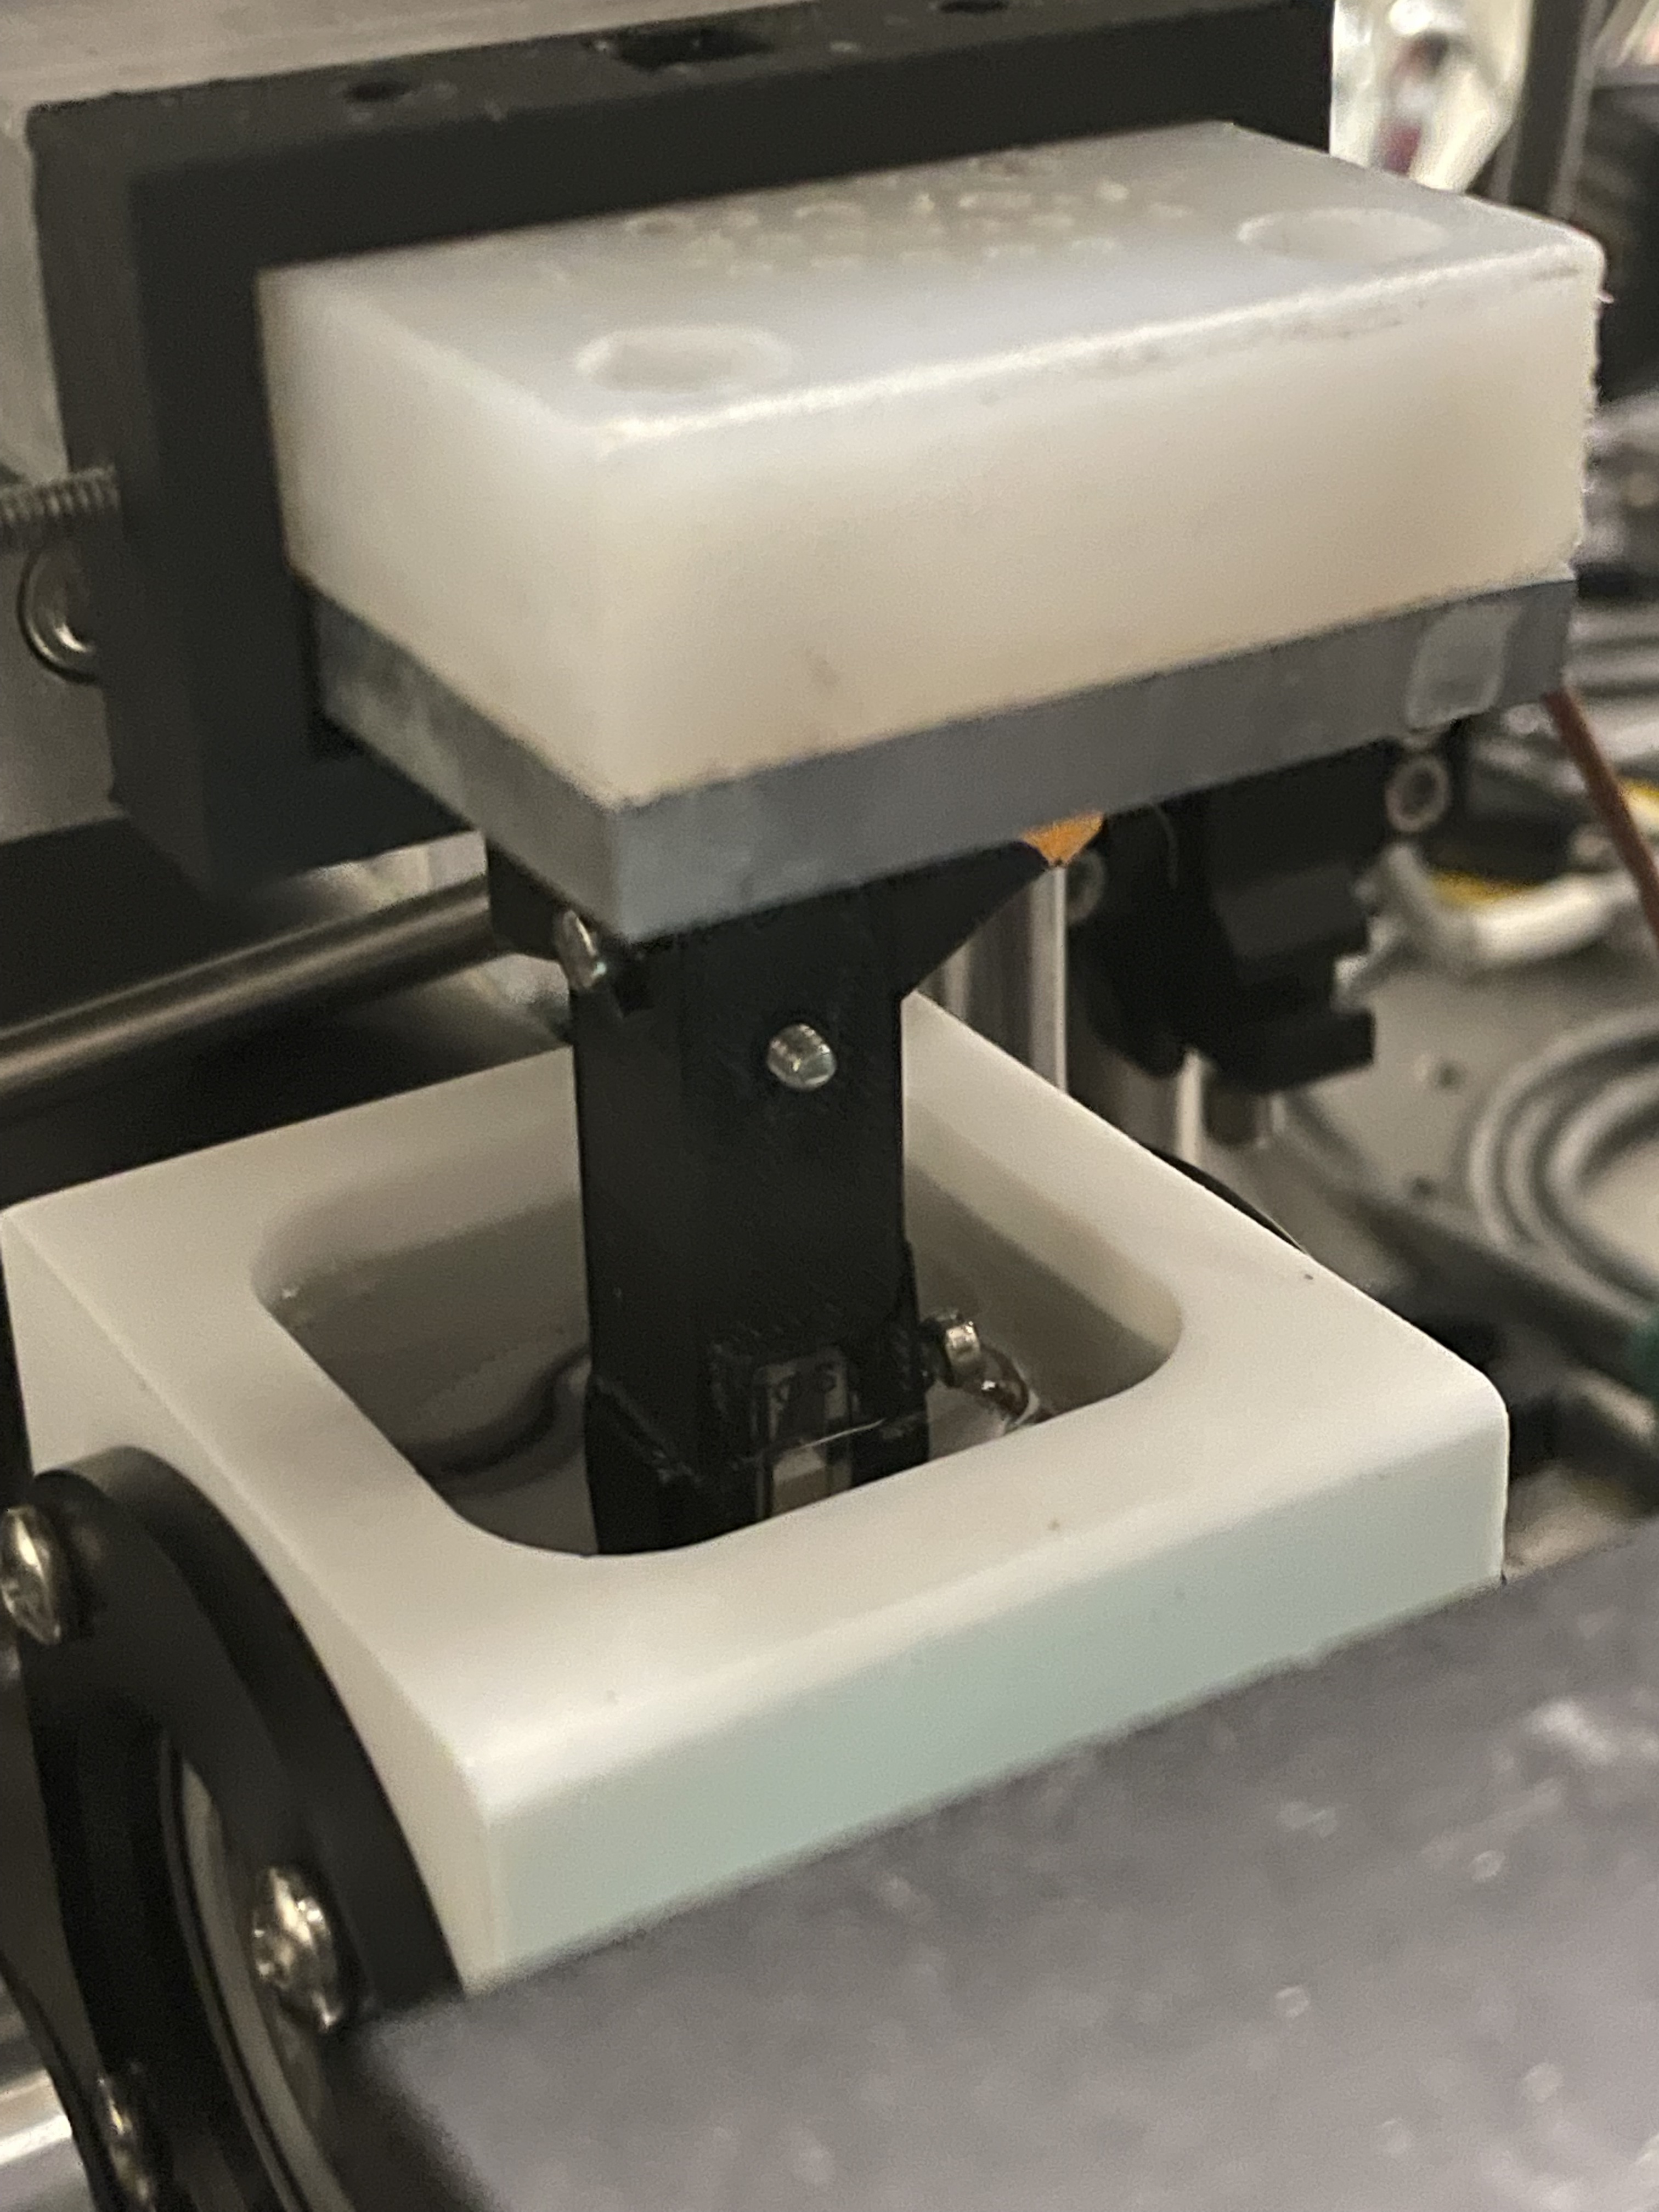
Here is a top view of the imaging stage for the light sheet microscope. The excitation source (the laser!) is on the left and our detection camera that is doing the imaging is on the bottom. This chamber is filled with water and we are able to maintain the chamber at a specific temperature.
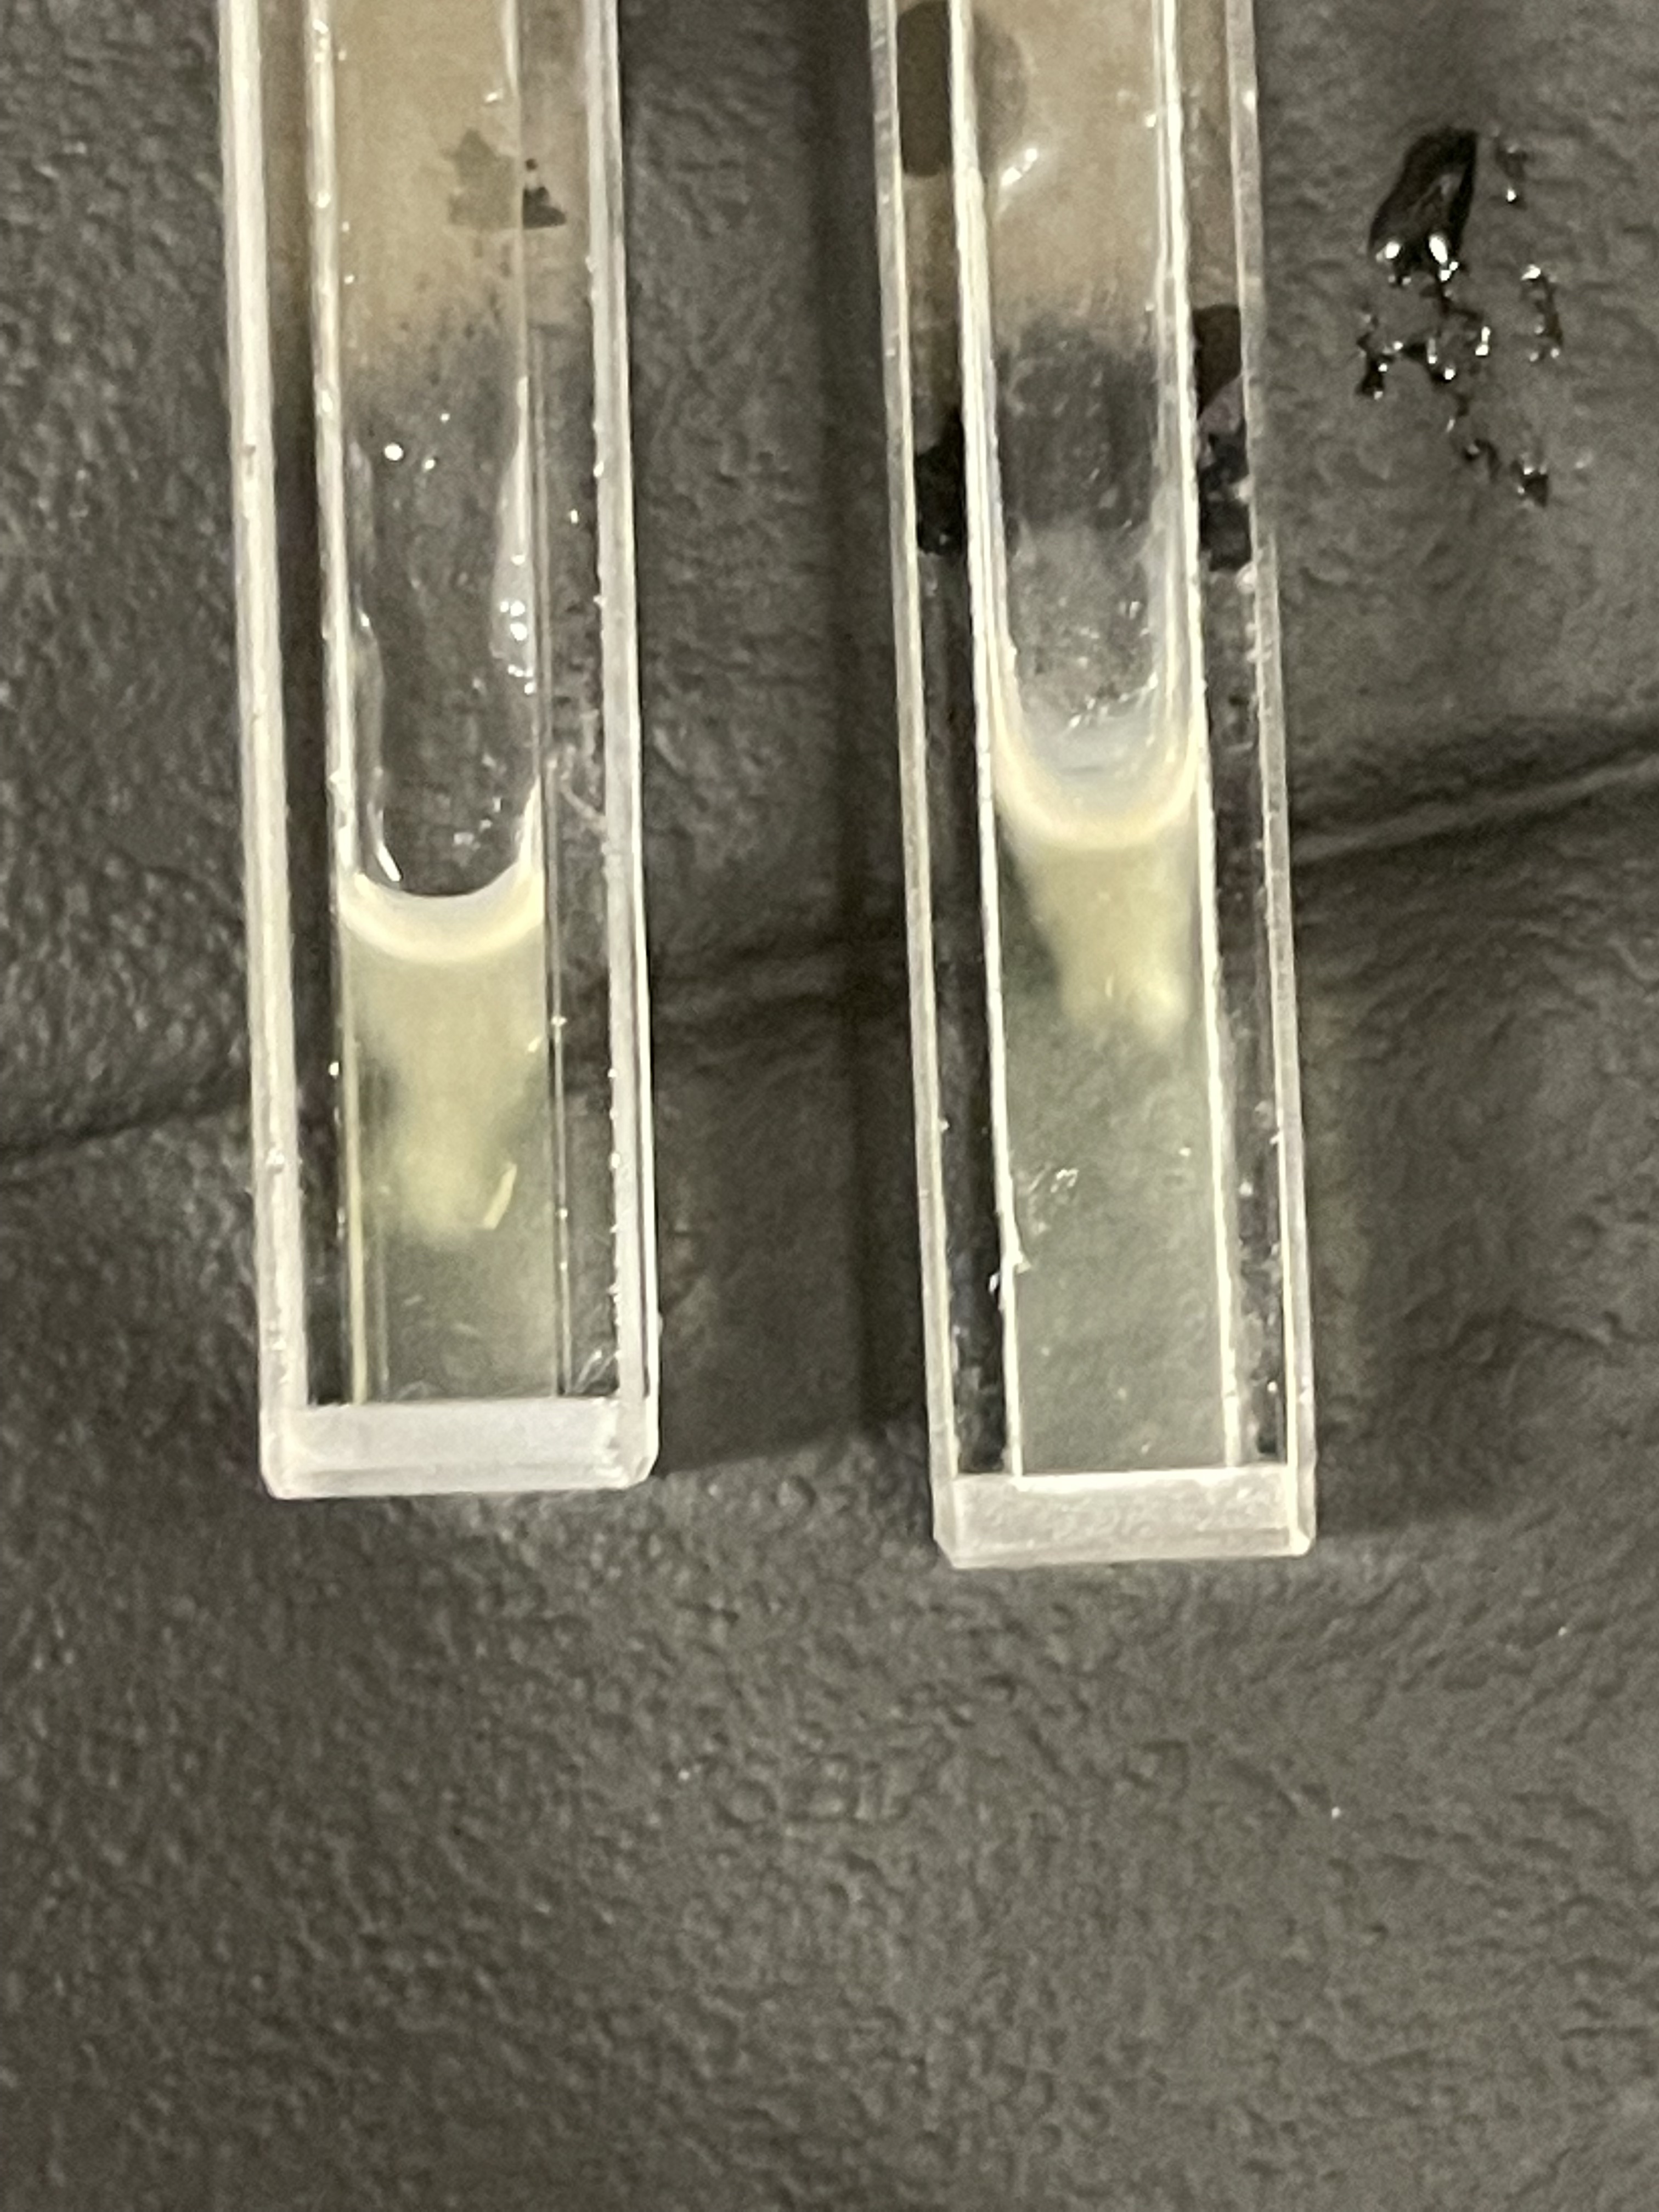
In our experiments, we diluted an overnight culture of Dr. Spero’s Pseudomonas 1:1000 in 0.5% agar in a glass cuvette and incubated for 5 hours. We then either added LB as a control or tobramycin and then imaged every ten minutes for the next 8 hours. As we’re imaging, the sample on the stage is moved through space in the Z direction allowing us to take slices in the Z direction to obtain a 3 dimensional image of the growing Pseudomonas.
It’s also important to stress that we had to make a lot of these protocols ourselves - As far as we know, no one else has done 3D time series light sheet imaging on growing microbial communities and we did not know if this was going to work.
This is what a single timepoint looks like. Each timepoint takes ~15-20 seconds to acquire. In comparison, an image of the same size would take 10-15 mintues to obtain on a confocal microscope. The movement that you are seeing in the video is each slice that was taken in the Z direction.
We can track the effects of antibiotics over time by stitching maximum projection images from each timepoint. Here are timelapse videos of the Pseudomonas for 8 hours after the addition of the antibiotic. This imaging is extremely stable and we are able to track individual colonies over the entire time period. Starting with the tobramycin treated sample on the bottom, we see large colonies when we first add the tobramycin and see a fairly steady decline in the fluorescence over time, as the tobramycin begins to kill the colonies. In comparison, the control sample shows consistent fluorescence throughout the course of the time series. There are two potentially interesting dynamics that can be observed in the control sample as opposed to the sample that was treated with Tobramycin. First, you’ll notice that colonies in the control sample begin to move downward. This is then followed by a huge amount of fluorescence entering the frame from the top right. We observed that the control samples grow thick biofilms right at the surface of the agar air interface. We suspect that this is either placing mechanical stress on the agar and actually pushing the colonies below slightly deeper into the gel. We also lose the ability to observe small colonies and single bacteria as the control sample progresses, either due to a large amount of scattering from the large growth above increasing the overall background fluorescence, or due to lack of oxygen induced by the large growth above. I’ll touch on this later on but wanted to mentioned it now.
We can also create 3D images of the colonies within the cuvette by combining all of the slices that are taken at a single timepoint. Here, I am showing a single timepoint but this could be used to create a 3D timelapse of the growth and response of the Pseudomonas to antibiotic treatment.
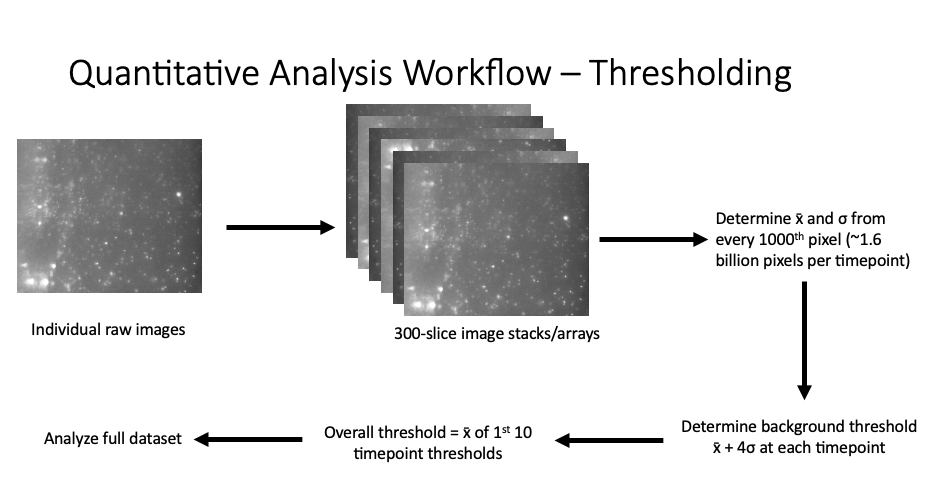
We ran into a lot of difficulties in quantifying these results. One of the major challenges that we faced was being able to identify bacteria as individuals as well as large colonies. These two states of bacterial existence demonstrate a large range of fluorescence intensities and made it difficult to determine the background level of fluorescence from the “true” fluorescence from the bacteria we were interested in. Lastly, it was difficult just to work with this data because of the size of the files. Each timepoint represented about 3.2 GB of data and so a single imaging series meant analyzing ~150GB of data. This presented a real challenge for the analysis.
To work through these challenges, we developed a custom Matlab script that combined all of the image slices from a single timepoint into an image stack. We then used a subset of the pixels in this stack to determine the background level of fluorescence present at each timepoint and determined a threshold level that we used to calculate the amount of fluorescence in each 3D timepoint. This was considered the intensity above threshold. We then took the mean calculated threshold from our first 10 time points and used this to analyze all of our data. We found that utilizing data from the first 10 time points was able to identify the majority of the colonies present in the earlier timepoints without identifying every single pixel as above threshold when the overall background fluorescence level increased in the later timepoints. All of this custom code can be found on my Github.
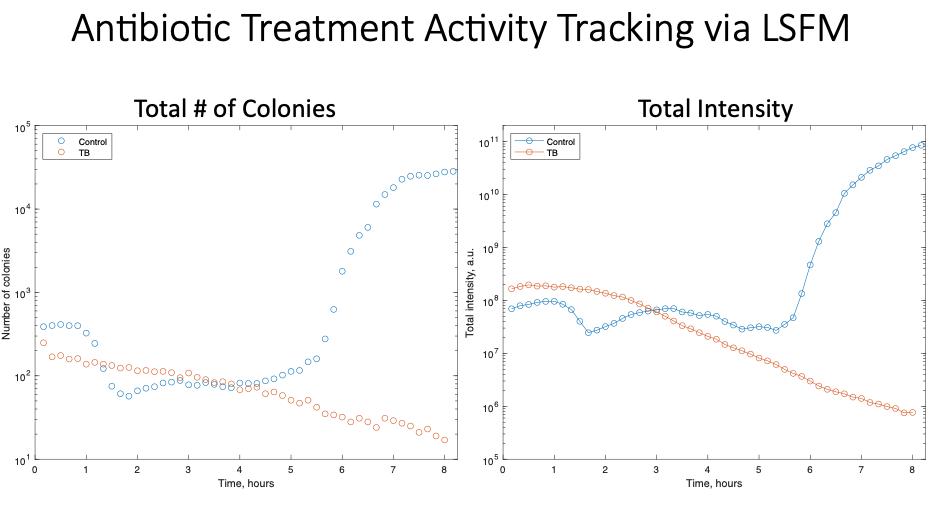
We performed our analysis using two metrics, the total number of colonies present at each time point as well as the total fluorescence at each time point. On the left, you can see the analysis for the total number of colonies present in the control (blue) and tobramycin (orange) samples over time. As we saw in the time-lapse videos, the samples treated with tobramycin demonstrate a steady decline in the number of colonies over time. In comparison, the control samples show a significant increase in the number of colonies. We saw very similar results measuring by the total intensity at each time point, with a decline in the overall fluorescence over time in the tobramycin sample and an overall increase in the fluorescence in the control sample.
We also created surface plots, which show the sum of all the 3D stacks in a single timepoint over space. Overall, you can see that not much changes in the tobramycin sample on the right and a significant increase in the fluorescence intensity occurs in the control sample on the left. However, I want to use the plot on the left to point out some interesting dynamics that we observed in the growth of the Pseduomonas over time. You’ll notice that the control sample fluctuates at a single level for a majority of the time until the large growth from the surface of the agar drastically increases the fluorescence that we observe. There are some interesting dynamics going on here. It seems that there could be some “carrying capacity” associated with the agar beyond the surface that is then eventually overcome by the growth from the surface. This highlights something that could potentially be missed by just imaging at a single timepoint. We are hypothesizing that this could be cause by a hypoxic environment created by the consumption of oxygen by the large surface growth, bacterial colony interactions we can’t observe with the microscope, or some other nutritional limitation caused by the large growth. But overall, we know that we don’t observe this in the tobramycin group, leading us to believe that these are bacterial-induced (or at least bacterial growth related) factors that are causing this interaction.
Overall, I learned a lot throughout this term! I learned TONS about microscopy and image analysis and even learned Matlab! All of this was absolutely really challenging, but that’s the whole point, right?? Overall, I would call the project a huge success. Through my work, we were able to figure out that you can use light sheet microscopy to track bacterial growth and death over time, both by simply looking at the images and timelapses and this holds up well when we quantify the results as well! We didn’t see any real problems with photobleaching, even though we were imaging the bacteria every 10 minutes, something that you could never do confocal microcopy. A similar scan (i.e. the same are of image) would have taken 10-15 minutes to image on a confocal microscope. On the light sheet, each stack of 300 images took ~15 seconds to obtain (40X faster!).
Obviously, this was just a rotation project that took place over three months and so there is a lot more that could have been done. The obvious next step is to explore the interesting growth dynamics that we observed and try to figure out how much of that is coming from a potential oxygen gradient (like Dr. Spero found), how much is coming from direct interactions between the bacteria, and how much is due to nutrient availability (even though the real answer is probably a mix of all three). Based on the images that I was able to take, it would also likely be possible to determine the grwoth rate of each individual colony, which could give further insights into the growth dynamics and the factors that contribute to it. There is also lots of potential to force the bacteria to grow in 3D shapes in order to mimic the gut and other areas inside the body to understand how the terrain around bacteria can impact their growth. Lastly, there are endless combinations of multiple bacteria interactions and the effects of multiple antibiotics at the same time that could be explored using light sheet microscopy. So many future things!
I couldn’t have done any of this without the help of everyone in the Parthasarathy lab, Dr. Spero, and countless other people from the University of Oregon and the Institute of Molecular Biology. Go Ducks!
Pictures from Fall Term
 |
 |
 |
|
 |
 |
 |
 |
 |
 |